Hello Folks,
Sometimes you will not understand what exactly the WebLogic Server thinks when it throws some Errors / Exceptions, WebLogic Server is Open enough that it will allow you to understand it completely at the microscopic level, but you got to have eyes and mind to understand it :).
Whenever WebLogic Server Works it will say what it is doing in very brief way by printing it over the logs like Server Logs, Access Logs, Domain logs, Diagnostics, etc.., However they are very specific and cannot print much more information for you to help unless you need them, as they have disadvantages too, one is you will have no more disk space in some days if you enable the trace level of logging.
But you might need this to be enabled for Debug Level to Understand few Operations of WebLogic Server, in this posting we will study how to enable the Debug Logging and How to Enable the Debugs for Cluster Component for Session Replication.
I have setup the WebLogic Server Version 10.3.0 at my labs and will configure and show it you how the Debugs Work.
Step 1. Verify Running Servers are in Cluster for Enabling Replication Debugs - If you don't have clustered server there is no use of enabling Debug for Replication :)
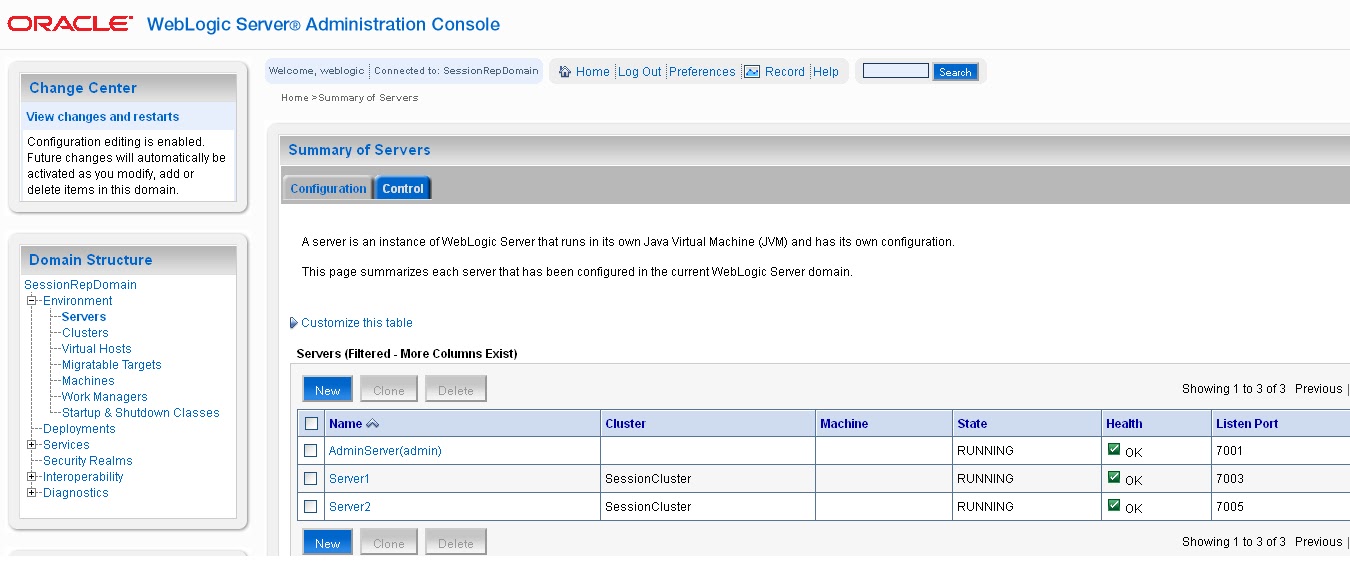
Step 2 : Click on Server which needs Debug to be enabled.
For an instance click on Server1 -- Logging


Step 4 : Select Severity Level as "Debug" for Server Log file, Standard Out, Minimum Severity to Log And Check the Check Box : "Redirect stdout logging enabled" -- Save it.
Step 5 : Repeat This For All the Server on which you need to know exactly how its behaving during the operation.
Note : This Configuration Change Requires Server Restart to Take Effect, Before We Restart the Servers, we will enable the Debugs for Session Replication.
Step 6 : Click On Debug Tab on Server Configuration Page.
Step 7: Expand "weblogic" -> "core" -->"cluster" Click on following Debugs and Click Enable.
--> DebugReplication
--> DebugReplicationDetails
--> DebugCluster - In Case if you think you might be running issue with cluster setup.

Step 8 : Activate the Changes.
Note : You can do all above operation in case if your managed servers are down also.
While you are starting the server, you can notice the Cluster Debugs as below.
####<Mar 1, 2012 9:22:53 AM IST> <Debug> <Cluster> <SDYADE-LAP> <Server1> <[STANDBY] ExecuteThread: '1' for queue: 'weblogic.kernel.Default (self-tuning)'> <<WLS Kernel>> <> <> <1330573973281> <BEA-000000> <Sending senderNum:0 seqNum:0 message:Heartbeat with 0 items outgoing message:message:[115, 114, 0, 33, 119, 101, 98, 108, 111, 103, 105, 99, 46, 99, 108, 117, 115, 116, 101, 114, 46, 72, 101, 97, 114, 116, 98, 101, 97, 116, 77, 101, 115, 115, 97, 103, 101, -98, -77, -6, 99, 112, -53, -92, -119, 12, 0, 0, 119, 2, 0, 0, 120, 112, 115, 114, 0, 19, 106, 97, 118, 97, 46, 117, 116, 105, 108, 46, 65, 114, 114, 97, 121, 76, 105, 115, 116, 120, -127, -46, 29, -103, -57, 97, -99, 3, 0, 1, 73, 0, 4, 115, 105, 122, 101, 119, 2, 0, 0, 120, 112, 0, 0, 0, 0, 119, 4, 0, 0, 0, 0, 120, 119, 8, 0, 0, 1, 53, -52, 99, -105, 33, 120, 0, 0, 0, 0, 0], size:123, seqNum:0, messageVersion:0,0,0>
Step 10: Deploy a Session Based Application to the cluster and Test the Application at Web Server Side and Test the Replication.

Debug for Debug Replication is as below :
####<Mar 1, 2012 9:29:53 AM IST> <Debug> <Replication> <SDYADE-LAP> <Server2> <[ACTIVE] ExecuteThread: '1' for queue: 'weblogic.kernel.Default (self-tuning)'> <<anonymous>> <> <> <1330574393984> <BEA-000000> <Creating primary -3805878817075153326>
Debugs for the Replication details sample :
####<Mar 1, 2012 9:29:53 AM IST> <Debug> <ReplicationDetails> <SDYADE-LAP> <Server2> <[ACTIVE] ExecuteThread: '1' for queue: 'weblogic.kernel.Default (self-tuning)'> <<anonymous>> <> <> <1330574393984> <BEA-000000> <Unable to create secondary for -3805878817075153326 on null>
####<Mar 1, 2012 9:29:54 AM IST> <Debug> <ReplicationDetails> <SDYADE-LAP> <Server2> <[ACTIVE] ExecuteThread: '1' for queue: 'weblogic.kernel.Default (self-tuning)'> <<anonymous>> <> <> <1330574394125> <BEA-000000> <Has secondary servers? false>
####<Mar 1, 2012 9:29:54 AM IST> <Debug> <ReplicationDetails> <SDYADE-LAP> <Server2> <[ACTIVE] ExecuteThread: '1' for queue: 'weblogic.kernel.Default (self-tuning)'> <<anonymous>> <> <> <1330574394125> <BEA-000000> <Current secondary server? null>
There seems to be some issue with the Secondary server creation for the session to be replicated, you can see that it has printed out the same message.
Now you are the Administrator, WebLogic Server has informed that what it is going through, please help it to help you to replicate the application session to the secondary server successfully.
Hope After this posting you are able to Debug the issues with different components too, keep trying.
Let me know if you need any more help.
Regards
Shailesh Dyade
1 comment:
Hi ,
If we change log level to debug mode and weblogic -> management -> DebugJMX
weblogic -> management -> DebugJMXCompatibility enable is there any impact on application performance?
Post a Comment