Thursday, March 1, 2012

Debugging WebLogic Server Process

Hello Folks,

Sometimes you will not understand what exactly the WebLogic Server thinks when it throws some Errors / Exceptions, WebLogic Server is Open enough that it will allow you to understand it completely at the microscopic level, but you got to have eyes and mind to understand it :).

Whenever WebLogic Server Works it will say what it is doing in very brief way by printing it over the logs like Server Logs, Access Logs, Domain logs, Diagnostics, etc.., However they are very specific and cannot print much more information for you to help unless you need them, as they have disadvantages too, one is you will have no more disk space in some days if you enable the trace level of logging.

But you might need this to be enabled for Debug Level to Understand few Operations of WebLogic Server, in this posting we will study how to enable the Debug Logging and How to Enable the Debugs for Cluster Component for Session Replication.

I have setup the WebLogic Server Version 10.3.0 at my labs and will configure and show it you how the Debugs Work.

Step 1.  Verify Running Servers are in Cluster for Enabling Replication Debugs - If you don't have clustered server there is no use of enabling Debug for Replication :)
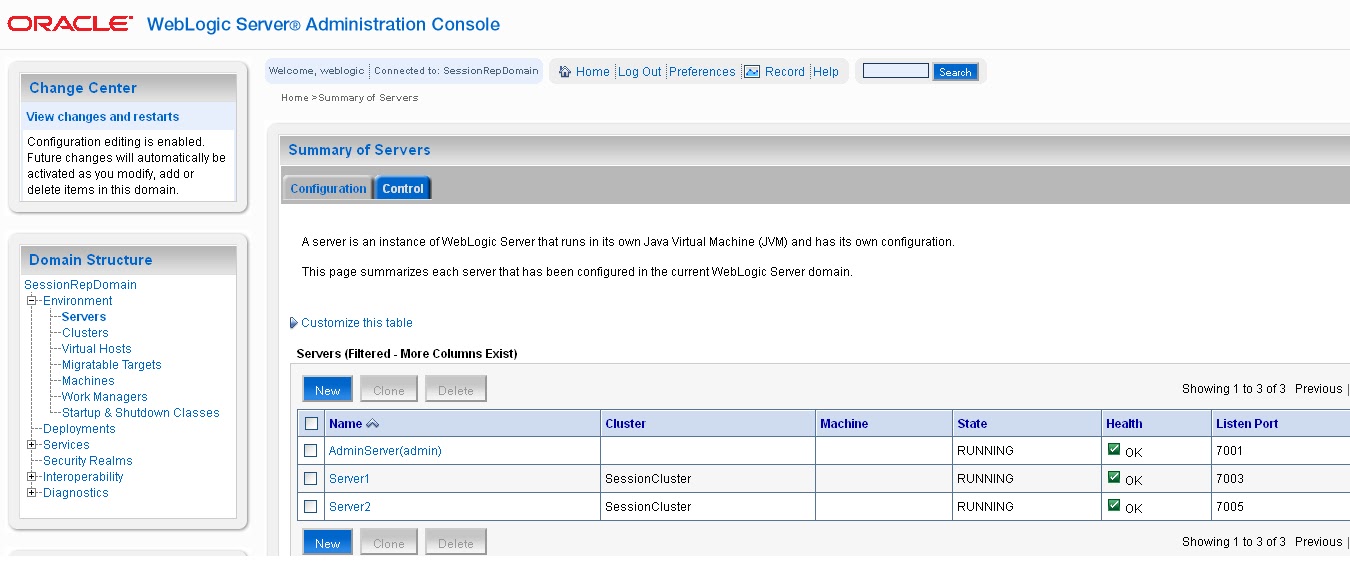

Step 2 : Click on Server which needs Debug to be enabled.

For an instance click on Server1 -- Logging
Step 3: Scroll down and Click on Advanced

Step 4 : Select Severity Level as "Debug" for Server Log file, Standard Out, Minimum Severity to Log And Check the Check Box : "Redirect stdout logging enabled" -- Save it.

Step 5 : Repeat This For All the Server on which you need to know exactly how its behaving during the operation.

Note : This Configuration Change Requires Server Restart to Take Effect, Before We Restart the Servers, we will enable the Debugs for Session Replication.

Step 6 : Click On Debug Tab on Server Configuration Page.

Step 7: Expand "weblogic" -> "core" -->"cluster" Click on following Debugs and Click Enable.

--> DebugReplication
--> DebugReplicationDetails
--> DebugCluster - In Case if you think you might be running issue with cluster setup. 

Step 8 : Activate the Changes.

Step 9: Restart the Servers

Note : You can do all above operation in case if your managed servers are down also.

While you are starting the server, you can notice the Cluster Debugs as below.

####<Mar 1, 2012 9:22:53 AM IST> <Debug> <Cluster> <SDYADE-LAP> <Server1> <[STANDBY] ExecuteThread: '1' for queue: 'weblogic.kernel.Default (self-tuning)'> <<WLS Kernel>> <> <> <1330573973281> <BEA-000000> <Sending senderNum:0 seqNum:0 message:Heartbeat with 0 items outgoing message:message:[115, 114, 0, 33, 119, 101, 98, 108, 111, 103, 105, 99, 46, 99, 108, 117, 115, 116, 101, 114, 46, 72, 101, 97, 114, 116, 98, 101, 97, 116, 77, 101, 115, 115, 97, 103, 101, -98, -77, -6, 99, 112, -53, -92, -119, 12, 0, 0, 119, 2, 0, 0, 120, 112, 115, 114, 0, 19, 106, 97, 118, 97, 46, 117, 116, 105, 108, 46, 65, 114, 114, 97, 121, 76, 105, 115, 116, 120, -127, -46, 29, -103, -57, 97, -99, 3, 0, 1, 73, 0, 4, 115, 105, 122, 101, 119, 2, 0, 0, 120, 112, 0, 0, 0, 0, 119, 4, 0, 0, 0, 0, 120, 119, 8, 0, 0, 1, 53, -52, 99, -105, 33, 120, 0, 0, 0, 0, 0], size:123, seqNum:0, messageVersion:0,0,0>


Step 10: Deploy a Session Based Application to the cluster and Test the Application at Web Server Side and Test the Replication.

Step 11 : Shutdown the Server Where the Session is directed.

Debug for Debug Replication is as below : 

####<Mar 1, 2012 9:29:53 AM IST> <Debug> <Replication> <SDYADE-LAP> <Server2> <[ACTIVE] ExecuteThread: '1' for queue: 'weblogic.kernel.Default (self-tuning)'> <<anonymous>> <> <> <1330574393984> <BEA-000000> <Creating primary -3805878817075153326>
 

Debugs for the Replication details sample : 

####<Mar 1, 2012 9:29:53 AM IST> <Debug> <ReplicationDetails> <SDYADE-LAP> <Server2> <[ACTIVE] ExecuteThread: '1' for queue: 'weblogic.kernel.Default (self-tuning)'> <<anonymous>> <> <> <1330574393984> <BEA-000000> <Unable to create secondary for -3805878817075153326 on null>
####<Mar 1, 2012 9:29:54 AM IST> <Debug> <ReplicationDetails> <SDYADE-LAP> <Server2> <[ACTIVE] ExecuteThread: '1' for queue: 'weblogic.kernel.Default (self-tuning)'> <<anonymous>> <> <> <1330574394125> <BEA-000000> <Has secondary servers? false>
####<Mar 1, 2012 9:29:54 AM IST> <Debug> <ReplicationDetails> <SDYADE-LAP> <Server2> <[ACTIVE] ExecuteThread: '1' for queue: 'weblogic.kernel.Default (self-tuning)'> <<anonymous>> <> <> <1330574394125> <BEA-000000> <Current secondary server? null>


There seems to be some issue with the Secondary server creation for the session to be replicated, you can see that it has printed out the same message.


Now you are the Administrator, WebLogic Server has informed that what it is going through, please help it to help you to replicate the application session to the secondary server successfully.

Hope After this posting you are able to Debug the issues with different components too, keep trying.

Let me know if you need any more help.

Regards
Shailesh Dyade


Tuesday, January 31, 2012

Linux Newbie Administrator Guide

Good Start for Newbie in Linux Administration :

http://linux.about.com/od/embedded/l/blnewbie_toc.htm

Cheers..!!
Shailesh

Monday, January 30, 2012

20 Linux System Monitoring Tools Every SysAdmin Should Know

Something Interesting we should know about this, refer the following link, required for Application Server Administrators and Linux/Unix System Administrators.

http://www.cyberciti.biz/tips/top-linux-monitoring-tools.html

Cheers..!!
Shailesh Dyade

Monday, December 19, 2011

Welcome #1 Application Server : WebLogic Application Server 12c

Dear WebLogic Application Server Administrators,

This December Oracle has  given us the beautiful product and this is the time to explore the new WebLogic Application Server 12c, User interface is almost similar to previous versions, however the features what server has are unmatchable to any other application server in the market.

Following are few links to explore it and provide feedback about the same.
Application Server Download Link : 


New features in this version :


For More Information Refer to below blog :  
Please share your views and feedback about our new WebLogic Server 12c.


Monday, October 17, 2011

WebLogic Server Debug Flags to Analyze the Issues and Server Oprations

Note for Using WebLogic Server Debug Flags. 

 These flags can be applied using -Dweblogic.Debug= <Flag>


Also set the following parameter if using the script to apply -Dweblogic.log.LoggerSeverity="Trace" -Dweblogic.log.StdoutSeverityLevel="Debug"


Example -Dweblogic.Debug=weblogic.deployer,weblogic.deployerRuntime,weblogic.deployHelper,weblogic.deployTask


These debug flags are added in the JAVA_OPTIONS in the start script of the server as:
-Dweblogic.debug.DebugJMSBackEnd=true for example.


WLST

-Dwlst.debug.init = true


1—Application related debugs:


Application deployment: (Gives all the information about internal activities when the application is being deployed)

MasterDeployer
ApplicationContainer
DebugAppContainer
DebugDeploy
DebugDeployment
DebugDeploymentService
DebugDeploymentServiceInternal
DebugDeploymentServiceStatusUpdates
DebugDeploymentServiceTransport
DebugDeploymentServiceTransportHttp
DebugWebAppModule


EJBs: (Information on EJB deployments, container, connections)

DebugEjbCaching
DebugEjbCmpDeployment
DebugEjbCmpRuntime
DebugEjbCompilation
DebugEjbDeployment
DebugEjbInvoke
DebugEjbLocking
DebugEjbMdbConnection
DebugEjbPooling
DebugEjbSecurity
DebugEjbSwapping
DebugEjbTimers


For information on Java functionalities and classes of the applications deployed on the server:

ClassChangeNotifier
ClassFinder
ClassLoader
ClassLoaderVerbose
ClassloaderWebApp
ClasspathServlet
DebugBootstrapServlet
DebugClassRedef
DebugClassSize
DebugFileDistributionServlet
DebugJ2EEManagement


JPA – Java Persistence API (Application deployment, runtime information)

DebugJpaDataCache
DebugJpaEnhance
DebugJpaJdbcJdbc
DebugJpaJdbcSchema
DebugJpaJdbcSql
DebugJpaManage
DebugJpaMetaData
DebugJpaProfile
DebugJpaQuery
DebugJpaRuntime
DebugJpaTool


2—Core Concepts related debugs:


Cluster debugs: (Gives more information about cluster activities and data replication service)

DebugCluster
DebugClusterAnnouncements
DebugClusterFragments
DebugClusterHeartbeats
DebugConfigurationEdit
DebugConfigurationRuntime
DebugConnection
DebugConnectorService
DebugConsensusLeasing
DebugDGCEnrollment
DebugDRSCalls
DebugDRSHeartbeats
DebugDRSMessages
DebugDRSQueues
DebugDRSStateTransitions
DebugDRSUpdateStatus
DebugFailOver
DebugLoadBalancing
DebugHttpSessions
DebugReplication
DebugReplicationDetails
DebugRouting
DebugLeaderElection


Cluster messaging mode (Unicast and Multicast)

DebugUnicastMessaging
DebugClusterFragments
DebugClusterHeartbeats


XML parsing flags (To have more information about xml parsers, schema validations, xml entities)

DebugXMLEntityCacheDebugName:
DebugXMLEntityCacheIncludeClass
DebugXMLEntityCacheIncludeLocation
DebugXMLEntityCacheIncludeName
DebugXMLEntityCacheIncludeTime
DebugXMLEntityCacheOutputStream:
DebugXMLEntityCacheUseShortClass
DebugXMLRegistryDebugLevel
DebugXMLRegistryDebugName
DebugXMLRegistryIncludeClass
DebugXMLRegistryIncludeLocation
DebugXMLRegistryIncludeName
DebugXMLRegistryIncludeTime
DebugXMLRegistryOutputStream:
DebugXMLRegistryUseShortClass


JDBC (Get information about datasources, connection pool, connectivity)

DebugJDBCConn
DebugJDBCDriverLogging
DebugJDBCInternal
DebugJDBCRMI
DebugJDBCSQL


Server internal information: (lifecycle, input output)

DebugSelfTuning
DebugServerLifeCycle
DebugServerMigration
DebugStoreAdmin
DebugStoreIOLogical
DebugStoreIOLogicalBoot
DebugStoreIOPhysical
DebugStoreIOPhysicalVerbose
DebugLibraries


Communication related issues in servers:

DebugMuxer
DebugMuxerConnection
DebugMuxerDetail
DebugMuxerException
DebugMuxerTimeout


Resource information:


JMX:

DebugJMX
DebugJMXCompatibility
DebugJMXCore
DebugJMXDomain
DebugJMXEdit
DebugJMXRuntime


SNMP:

DebugSNMPAgent
DebugSNMPProtocolTCP
DebugSNMPToolkit


Server Protocols:


HTTP:

DebugHttp
DebugHttpLogging
DebugTunnelingConnection
DebugTunnelingConnectionTimeout


IIOP:

DebugIIOP
DebugIIOPConnection
DebugIIOPMarshal
DebugIIOPNaming
DebugIIOPOTS
DebugIIOPReplacer
DebugIIOPSecurity
DebugIIOPStartup
DebugIIOPTransport
DebugIIOPTunneling


JNDI related information of resources:

DebugJNDI
DebugJNDIFactories
DebugJNDIResolution

Windows service:

DebugPathSvc
DebugPathSvcVerbose
beasvc -debug “SERVICE NAME”


3– JMS


Basic JMS: (includes information about queues, topics, persistence stores, configurations)

DebugJMSAME
DebugJMSBackEnd
DebugJMSBoot
DebugJMSCDS
DebugJMSCommon
DebugJMSConfig
DebugJMSDispatcher
DebugJMSDistTopic
DebugJMSDurableSubscribers
DebugJMSFrontEnd
DebugJMSJDBCScavengeOnFlush
DebugJMSLocking
DebugJMSMessagePath
DebugJMSModule
DebugJMSPauseResume
DebugJMSStore
DebugJMST3Server
DebugJMSWrappers


SAF:

DebugSAFAdmin
DebugSAFLifeCycle
DebugSAFManager
DebugSAFMessagePath
DebugSAFReceivingAgent
DebugSAFSendingAgent
DebugSAFStore
DebugSAFTransport
DebugSAFVerbose
DebugJMSSAF


Messaging Bridge:

DebugMessaging
DebugMessagingBridgeRuntime
DebugMessagingBridgeRuntimeVerbose
DebugMessagingBridgeStartup
DebugMessagingKernel
DebugMessagingKernelBoot


Resource Adapter:

DebugRA
DebugRAConnEvents
DebugRAConnections
DebugRADeployment
DebugRALifecycle
DebugRALocalOut
DebugRAParsing
DebugRAPoolVerbose
DebugRAPooling
DebugRASecurityCtx
DebugRAWork
DebugRAWorkEvents
DebugRAXAin
DebugRAXAout
DebugRAXAwork


4– JTA (XA and NON-XA)
 
DebugJTA2PC
DebugJTA2PCStackTrace
DebugJTAAPI
DebugJTAGateway
DebugJTAGatewayStackTrace
DebugJTAHealth
DebugJTAJDBC
DebugJTALLR
DebugJTALifecycle
DebugJTAMigration
DebugJTANaming
DebugJTANamingStackTrace
DebugJTANonXA
DebugJTAPropagate
DebugJTARMI
DebugJTARecovery
DebugJTARecoveryStackTrace
DebugJTAResourceHealth
DebugJTAResourceName
DebugJTATLOG
DebugJTATransactionName
DebugJTAXA
DebugJTAXAStackTrace


5– Security


Basic security (SSL, Authentication, authorization, auditing, keystores, roles, policies)

DebugSSL
DebugSecurityAdjudicator
DebugSecurityAtn
DebugSecurityAtz
DebugSecurityAuditor
DebugSecurityCertPath
DebugSecurityCredMap
DebugSecurityEEngine
DebugSecurityEncryptionService
DebugSecurityJACC
DebugSecurityJACCNonPolicy
DebugSecurityJACCPolicy
DebugSecurityKeyStore
DebugSecurityPasswordPolicy
DebugSecurityPredicate
DebugSecurityRealm
DebugSecurityRoleMap
DebugSecuritySSL
DebugSecuritySSLEaten
DebugSecurityService
DebugSecurityUserLockout


SAML:

DebugSecuritySAML2Atn
DebugSecuritySAML2CredMap
DebugSecuritySAML2Lib
DebugSecuritySAML2Service
DebugSecuritySAMLAtn
DebugSecuritySAMLCredMap
DebugSecuritySAMLLib
DebugSecuritySAMLService


6– WLDF (Includes watches, harvester, other modules):

DebugDiagnosticAccessor
DebugDiagnosticArchive
DebugDiagnosticArchiveRetirement
DebugDiagnosticCollections
DebugDiagnosticContext
DebugDiagnosticFileArchive
DebugDiagnosticImage
DebugDiagnosticInstrumentation
DebugDiagnosticInstrumentationActions
DebugDiagnosticInstrumentationConfig
DebugDiagnosticInstrumentationEvents
DebugDiagnosticInstrumentationWeaving
DebugDiagnosticInstrumentationWeavingMatches
DebugDiagnosticJdbcArchive
DebugDiagnosticLifecycleHandlers
DebugDiagnosticQuery
DebugDiagnosticWatch
DebugDiagnosticWlstoreArchive
DebugDiagnosticsHarvester
DebugDiagnosticsHarvesterData
DebugDiagnosticsHarvesterMBeanPlugin
DebugDiagnosticsHarvesterTreeBeanPlugin
DebugDiagnosticsModule